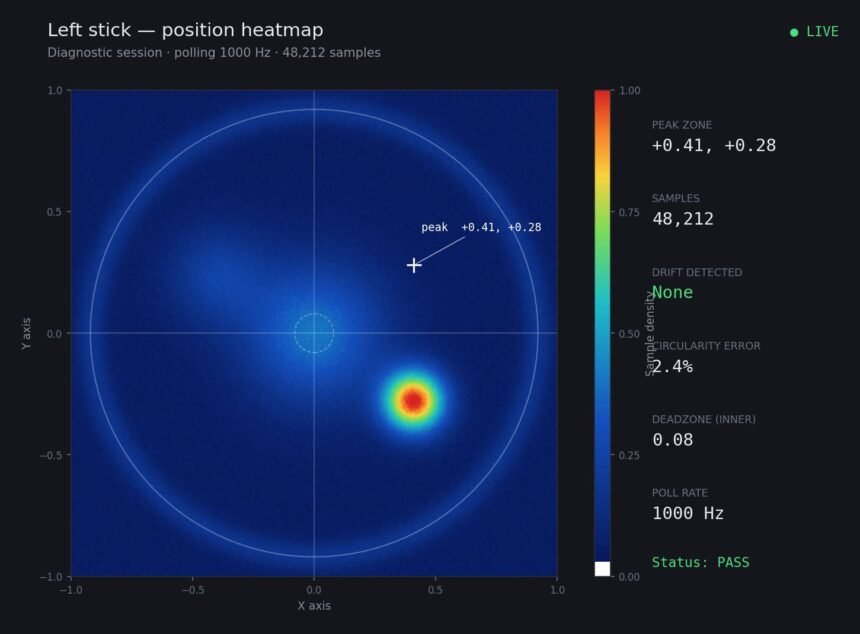
Someone posted a stick drift heatmap in a forum thread asking if their controller was dying: a red and orange blob sitting slightly off-center on an otherwise blue grid, and the replies were split evenly between “that’s fine” and “replace it immediately.” Neither side was reading it correctly, because interpreting stick drift heatmaps is less intuitive than it looks, and a little color theory goes further than most guides bother explaining.
What Stick Drift Heatmaps Are Actually Showing You
A heatmap plots where your analog stick’s reported position sits over time, usually while you leave the stick untouched at rest. Blue or cool colors represent positions the stick rarely or never reports. Red or warm colors represent positions the stick reports frequently. On a perfectly healthy stick at rest, you would expect to see one small, tight, hot spot dead center, since a stick with no drift reports the same resting position over and over with no meaningful variation.
Stick drift diagnostics work by making that resting behavior visible instead of abstract, which is the entire point of using a heatmap over a single summary number. A single number, like “3 degrees of drift,” tells you a summary statistic. A heatmap tells you the actual shape and distribution of that drift, whether it wanders in a wide, unstable pattern or sits in a second, smaller, consistent hot spot slightly off from center. Those two patterns mean genuinely different things about what is happening mechanically inside the stick.
Analog stick heatmap tools generate this visualization by logging thousands of position readings over a testing period, typically thirty seconds to a few minutes, and plotting the frequency of each reported coordinate as a color intensity. Any analog stick heatmap tool works on this same basic principle. The longer the test runs, the more reliable the resulting pattern becomes, since a short test can produce a misleadingly clean or messy result purely from limited sample size.
How to Actually Read the Colors and Shapes Correctly
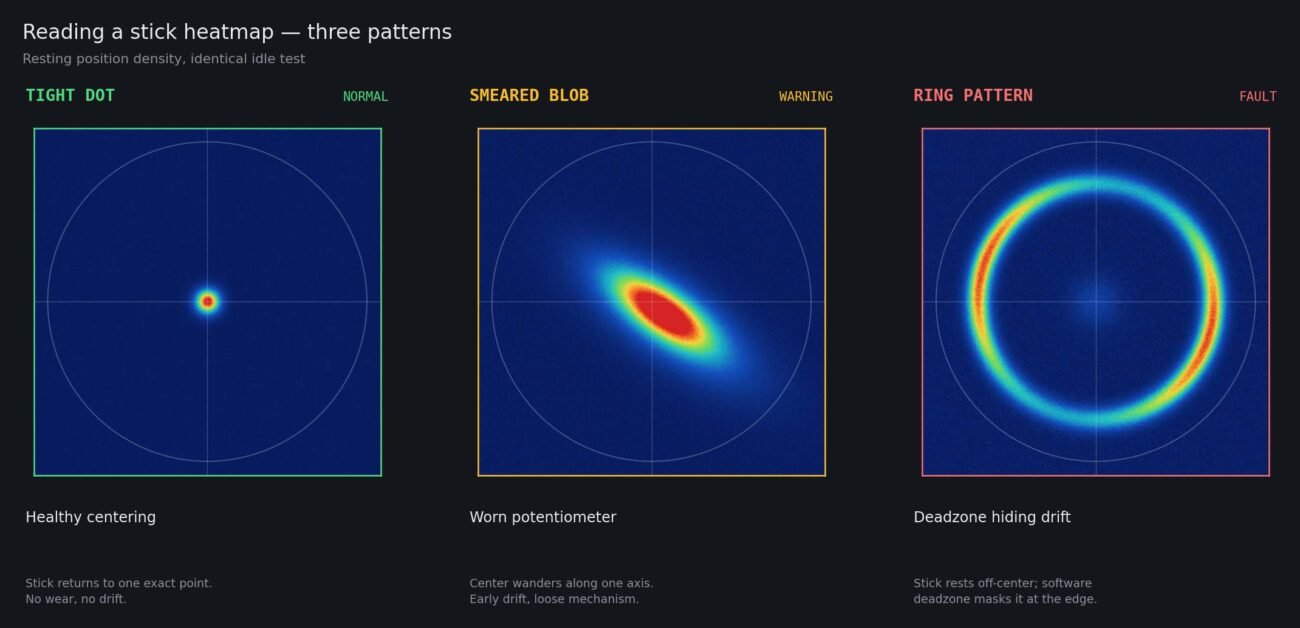
A single tight hot spot, wherever it sits, is actually the important detail people miss. A hot spot sitting slightly off from true center but staying tight and consistent usually indicates a calibration offset rather than active drift, something a re-calibration in software can often correct without touching the hardware at all. A hot spot that wanders or smears across a wider area, even if it stays roughly centered on average, indicates the stick mechanism itself is inconsistent, which calibration alone cannot fix since there is no single true position to calibrate toward.
Reading drift patterns correctly is really what interpreting a heatmap comes down to, and it means paying attention to shape, not just position. A tight circular hot spot slightly off-center is a different problem than an elongated smear running in one direction, which often points toward uneven wear along one specific axis of stick movement rather than a general degradation. A stick drift heatmap showing two distinct hot spots, rather than one, can indicate an intermittent contact issue where the stick’s reported position genuinely jumps between two states rather than drifting smoothly.
A third pattern worth recognizing is a faint ring or arc around the center point rather than a solid blob. This usually shows up on sticks with a specific type of wear where the return-to-center spring mechanism is slightly inconsistent, letting the stick settle at slightly different points on different releases rather than one single resting position. It looks less alarming than a smeared blob at first glance, since the individual points are faint, but the presence of a ring rather than a dot is itself the meaningful signal, regardless of how intense any single point in that ring appears.
Controller test heatmap results, and stick drift heatmaps specifically, also depend heavily on test duration and whether the controller was warmed up through use beforehand. A stick tested cold, immediately after being picked up, can show a tighter pattern than the same stick tested after twenty minutes of active play, since some wear-related inconsistency only becomes measurable once the mechanism has been worked through its actual range of motion repeatedly. Good stick drift diagnostics always account for this warm-up variable rather than testing once and treating the result as final.
If your heatmap shows a wandering or smeared pattern rather than a tight spot, recalibration will not fix it, since there is no single correct position to calibrate toward when the readings themselves are inconsistent. A pattern like this is exactly what a controller test heatmap is designed to surface. This pattern points toward physical wear in the stick’s contact mechanism, worth addressing through cleaning first as the lower-effort option, with replacement as the realistic next step if cleaning does not resolve it.
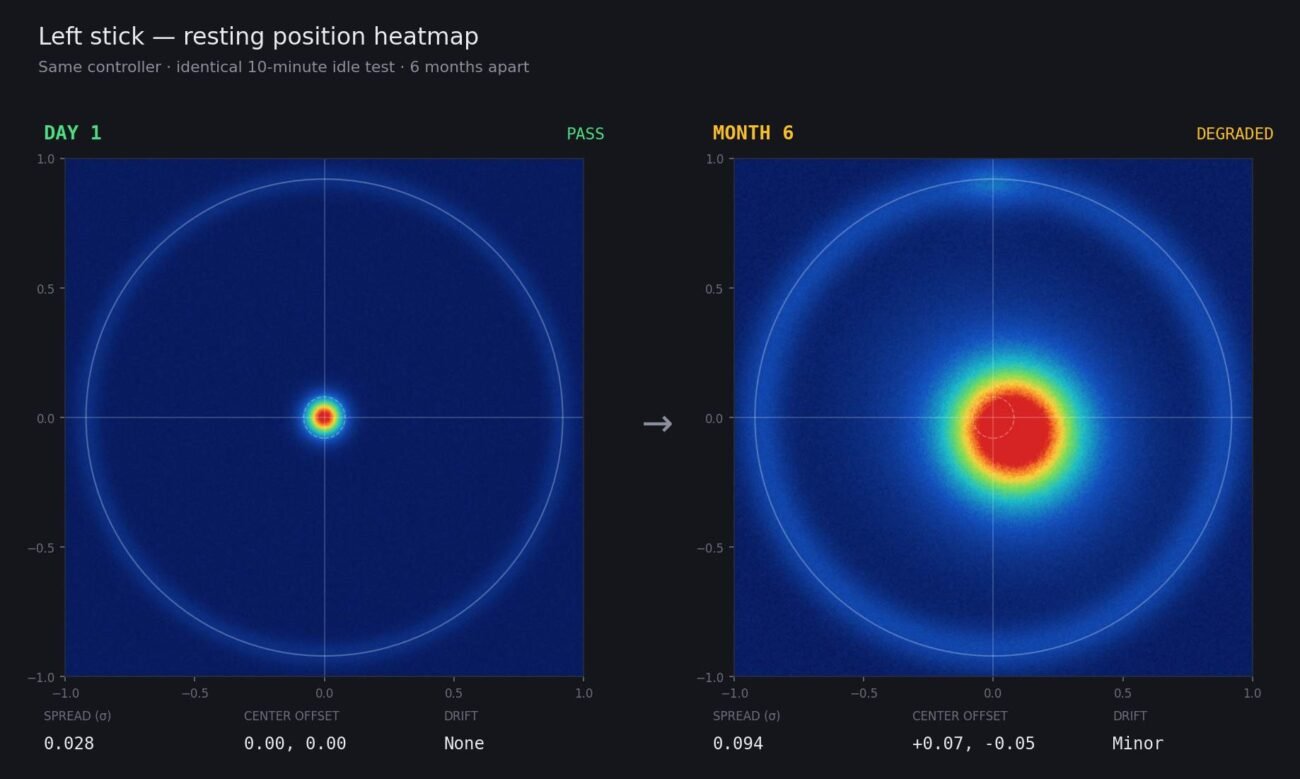
Stick drift visualization, and stick drift heatmaps specifically, is most useful as a tracking tool over time, not merely a one-time diagnostic. Reading drift patterns over multiple sessions, not just once, is where the real value shows up. Save a heatmap when a controller is new, and run the same test again every few months. A gradually widening hot spot across multiple readings tells you concretely how quickly a specific controller is wearing under your specific play style, which is far more useful than a single snapshot for deciding when to actually intervene.
A single tight hot spot, even off-center, usually points to a calibration issue, not physical drift.
A wandering or smeared pattern points to physical wear that calibration alone cannot fix.
Two distinct hot spots can indicate an intermittent contact issue rather than smooth gradual drift.
Run the test for at least thirty seconds for a reliable pattern; shorter tests can mislead.
Test both cold and after active play, since wear-related inconsistency can appear only under load.
Try software recalibration first for tight off-center spots before assuming a hardware problem.
Save heatmaps over time to track wear progression rather than relying on a single reading.
Do not judge severity from color alone; judge it from the shape and spread of the pattern.
Stick drift heatmaps are not a pass-or-fail test. They are a shape you have to learn to read, and once you can read them, they tell you more honestly what is happening inside your controller than any single drift number ever could.
Nigel Twumasi, founder of Gamepad Tester, is a tech expert providing trusted solutions for controller testing, repair, and gaming performance improvement.